
AI STATISTICS DASHBOARD
Your data. Clearer decisions.
Bring spreadsheets, finance, sales and operations into one live dashboard. The AI explains what changed, why, and what to do next, in plain English or Bahasa Malaysia.
- Live updates
- Ask in plain language
- Multi-branch
- Malaysia-hosted or on-premise
OverviewLive
Revenue128K
Orders2,431
On time96%
Illustrative data
Less searching. More doing.
How your numbers become decisions.
- Connect your sourcesSpreadsheets, accounting, sales, clinic, HR or learning systems.
- AI tidies and joinsDuplicates, formats and mismatched names are cleaned up automatically.
- One live viewKey numbers for every branch and team, updated on schedule.
- Next steps, not just chartsThe AI flags what changed and routes the action to the right owner.
What you get.
See
For owners and managers.
- Live KPIsRevenue, orders, on-time rate, stock and any metric you track, by branch, team or period.
- Drill downFrom the group total to a single site or product in two clicks.
- Mobile-friendlyCheck the numbers on your phone between meetings.
Understand
AI that explains.
- Ask your dataType a question in plain English or Bahasa Malaysia and get an answer with the chart behind it.
- What changed and whyAutomatic explanations when a number moves, with the evidence.
- Anomaly alertsGet told when something is off before month-end.
Act
From insight to action.
- Assigned actionsEach exception goes to an owner with a due date, and is tracked to done.
- Scheduled briefsA short summary to email, WhatsApp or Teams every morning or week.
Control
For IT and finance.
- Role-based accessBranch managers see their branch. Leadership sees everything.
- Your environmentCloud, Malaysia-hosted or on-premise, with no customer data used to train AI models.
Dashboards we build.
Clinic and healthcare
Patient volume, waiting times, stock and collections across branches.
Try the demoSales and finance
Revenue, margins, receivables and forecasts in one view.
Operations
Open actions, review queues and SLA performance across locations.
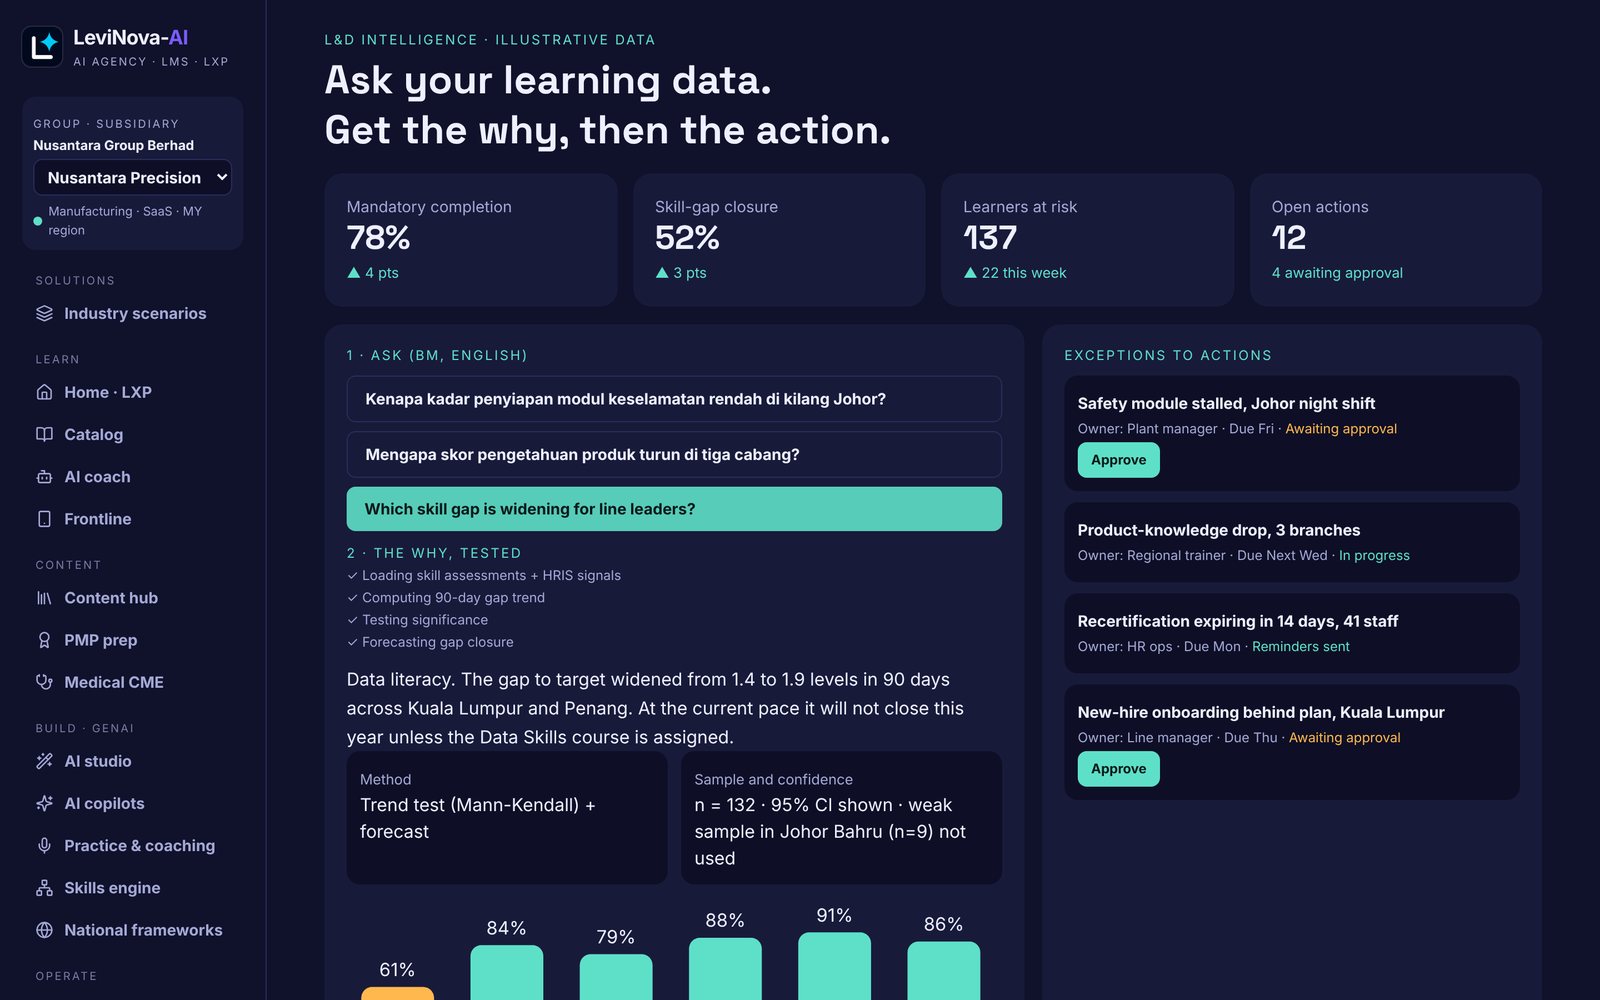
Example from the LeviNova AI LMS insights view. All figures shown are illustrative.
Start with the numbers you already have.
Send us a sample spreadsheet and we'll show you what the dashboard could look like.
Book a dashboard demo